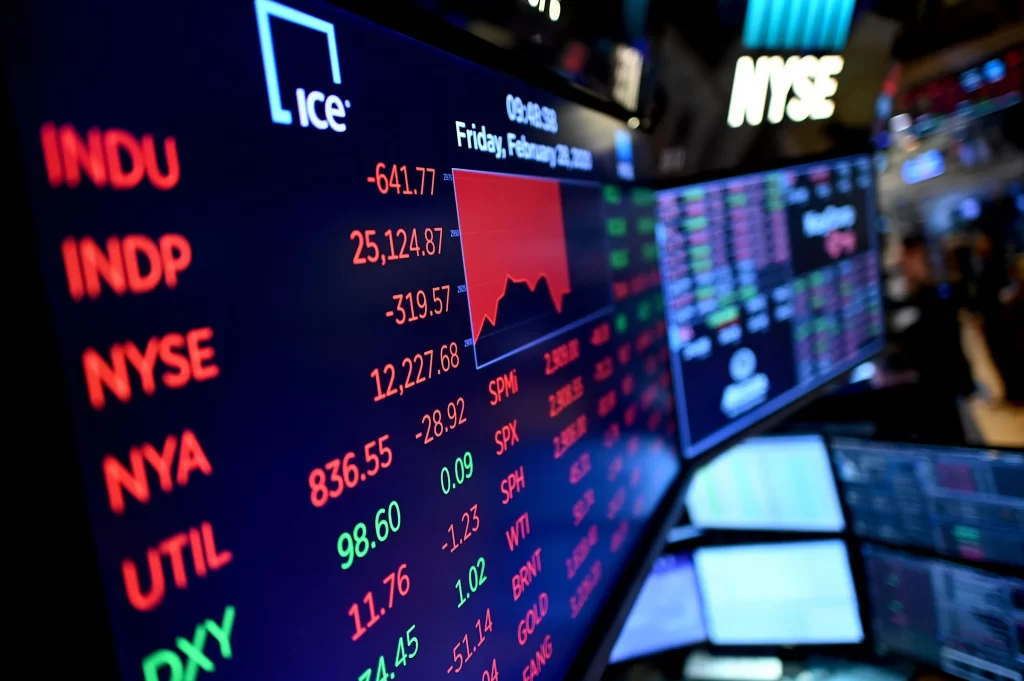
When external events cause uncertainty in the market, stock market volatility increases. Major stock indexes generally do not move more than 1% in a single day, but the COVID-19 pandemic caused frantic buying and selling. While it is difficult to gauge volatility in a given market, it can be helpful for investors to understand how market prices move over time. There are many reasons why volatility increases during a nervous stock market, and understanding them can help you avoid losing money.
A stock market that is too volatile is a dangerous place to invest. The recent decline in the U.S. stock market – the worst day since May – has investors nervous about their retirement plans. Keeping a cool head is essential during such times, but investors should not panic. While this may be tempting, investors should resist the temptation to sell and make changes. Regardless of the cause of this market volatility, there are some strategies you can use to protect your portfolio and stay calm during the difficult times.
One indicator of stock market volatility is the VIX Index. The VIX measures the expected volatility of the S&P 500 index over the next 30 days. This index is derived from the midpoint of real-time S&P 500 index option quotes. It generally increases when the S&P 500 index is declining, and decreases when the S&P 500 Index is rising. While the VIX Index can tell you how volatile the market is today, some asset classes are more volatile than others. For example, penny stocks, high-yield corporate bonds, and utilities are volatile.
While high-flying tech stocks can become more volatile during key events, blue-chip companies and other traditional stocks do not experience this type of volatility. They are both considered low-risk, depending on their volatility. For example, the volatility of butter is low, while the price of gas can drop drastically during periods of abundant supply. The higher the volatility, the higher the risk of a stock’s decline. This volatility can be unnerving, as the fear of a larger decline can make investors jumpy.
The standard deviation of an asset is also an indicator of volatility. The standard deviation of an asset is a measure of the difference in its past performance and its volatility over a given period of time. It captures the dispersion of returns around a mean. Volatility can be measured in different ways, including the volatility of an option’s price relative to the S&P 500 index. These measures are often considered more accurate and relevant than beta, which reflects historical volatility.
Although volatility is an important concept to understand when investing, investors should remember that it is not the same as risk. In fact, volatility is important only for investors who need to sell their stocks in a short period of time, or for people who are close to retirement age. Long-term investors, on the other hand, typically hold their stocks for years. If they plan to hold their investments for decades, volatility is not a big concern, as long-term volatility compounds investment returns.
You may also like
-
Behavioral Finance Strategies for Managing Investment Decisions in Volatile Meme Stock and Crypto Markets
-
Financial Strategies for Funding Longevity and Biohacking Treatments
-
Intergenerational Wealth Transfer in Modern Families: More Than Just Money
-
Importance of Credit Score Management in Achieving Financial Freedom
-
The Role of Financial Regulation in Protecting Consumers


